Working with factors
R plots data based on alphabetical order of groups on the X-axis. To change this order, or to reorder factors while working with linear models, use table_x_reorder (which uses the base R functions to do the job).
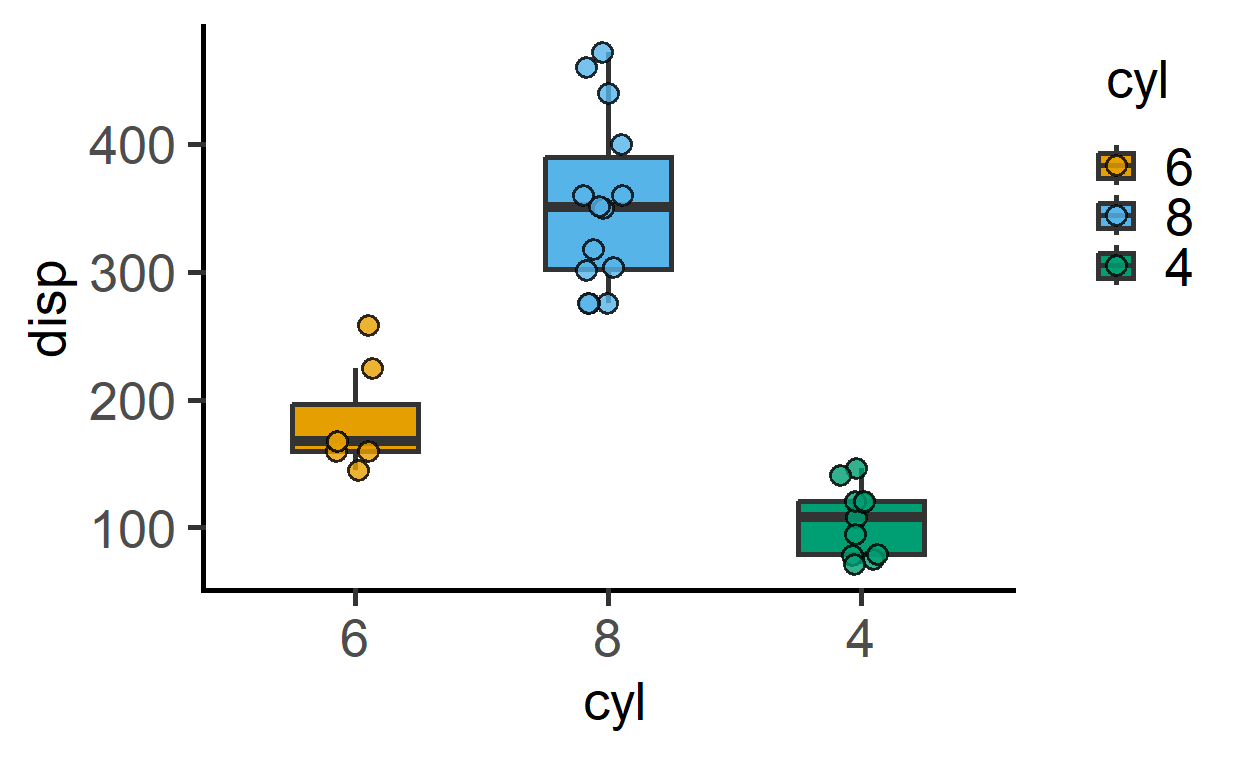
#graph of mtcars
plot_scatterbox(mtcars,
                cyl,     #default order of cyl
                disp)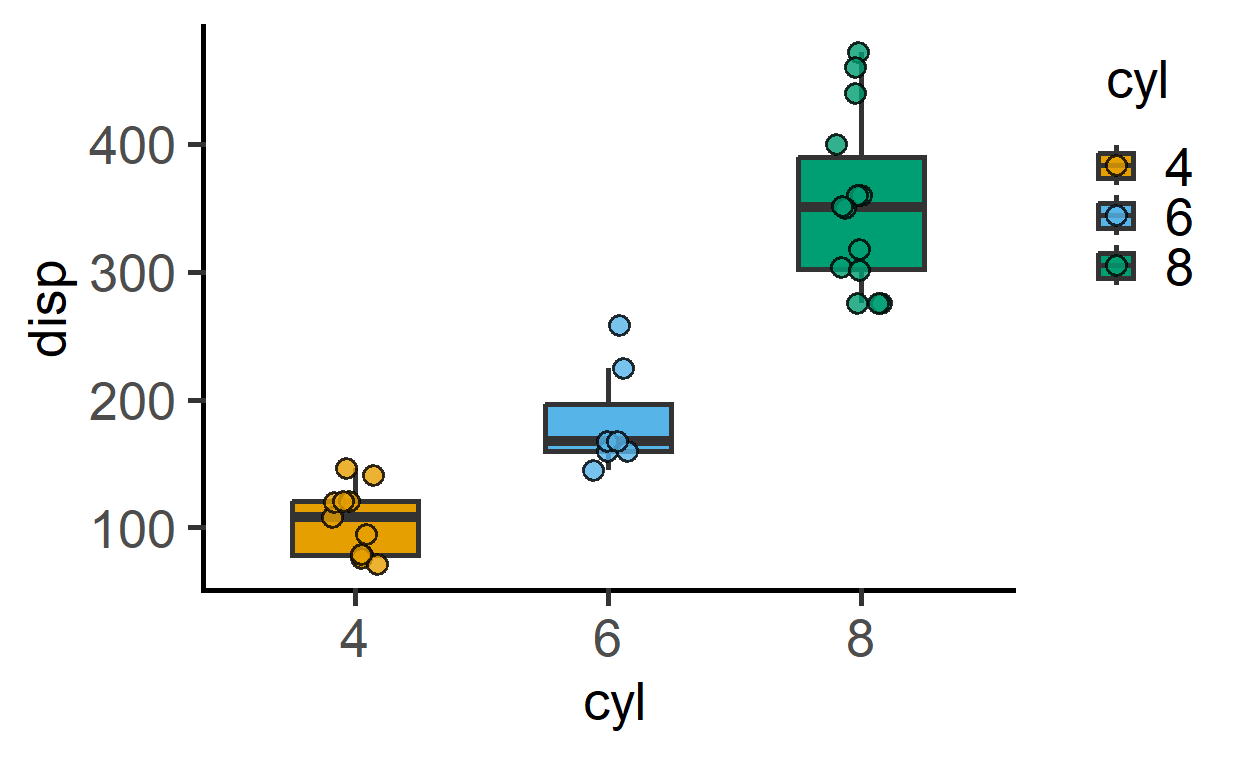
#change the order of cyl
mtcars2 <- table_x_reorder(data = mtcars,
                           xcol = "cyl",
                           OrderX = c("6", "8", "4"))
#plot saved table
plot_scatterbox(mtcars2,
                cyl,     #new order of cyl
                disp)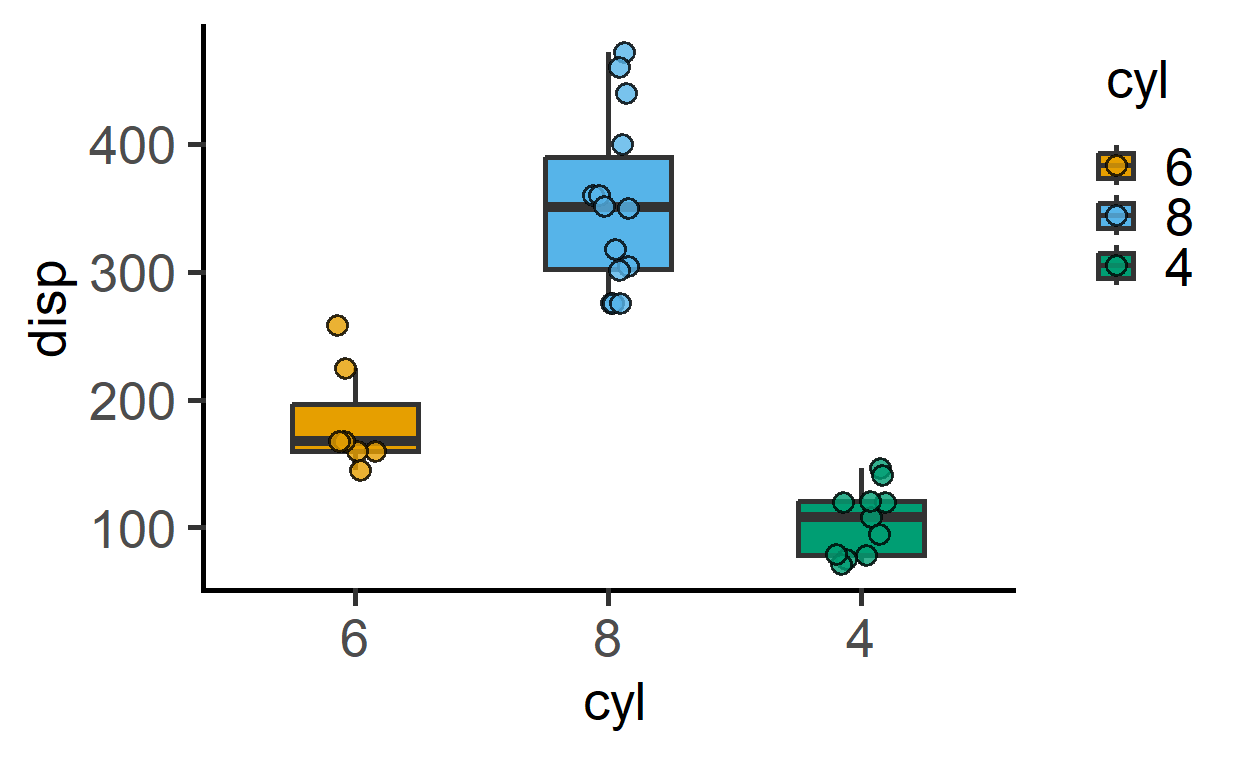
#run in one step
plot_scatterbox(table_x_reorder(mtcars,
                                "cyl",
                                c("6",
                                  "8",
                                  "4")),  #reordered cyl
                cyl,
                disp)