Code for two-way ANOVAs in ggplot2 can be quite long. grafify simplifies this a lot. You will need just 4 lines of code for a two-way ANOVA in R using grafify.
Data format
See the data help page and ensure data table is in the long-format.
Saving graphs
See Saving graphs for tips on how to save plots for making figures.
Experimental designs
The d in the name stands for dimensions or variables in the data. plot_3d... functions are for 1-way ANOVA with randomised blocks/repeated measures and plot_4d_... for 2-way ANOVA without or with randomised blocks; plot_4d_... require a second categorical factor that is mapped to bars or boxes through the points, bars or boxes argument.
These functions are generally useful when a third variable needs to be plotted to shapes of symbols. This is handy for plotting experiments with randomised blocks or repeated measures, where the shape of the symbol (shapes argument) is mapped to a “blocking factor” variable in the data table.
Three or more variables
Also see the vignette on graphing three or more variables. This page is an abridged version for plotting simple/ordinary and randomised-block design ANOVAs.
One-way ANOVAs
Simple one-way ANOVA
Any of the plot_ function can be used for this. See the vignette on plotting data with two variables.
One-way ANOVA with randomised-blocks
Use any of the plot_3d_ functions for this. The shapes argument will be mapped to the blocking variable. This variable cannot be left blank. If you don’t have a blocking variable, use the plot_ functions.
In some graphs below I have used fontsize = 18 to fit the the output better on the web page.
plot_3d_point_sd(data_1w_death,
                 Genotype,          #categorical X variable
                 Death,             #numeric Y variable
                 Experiment,        #blocking factor
                 fontsize = 18)+    #font size
  labs(title = "1way RB, mean/SD")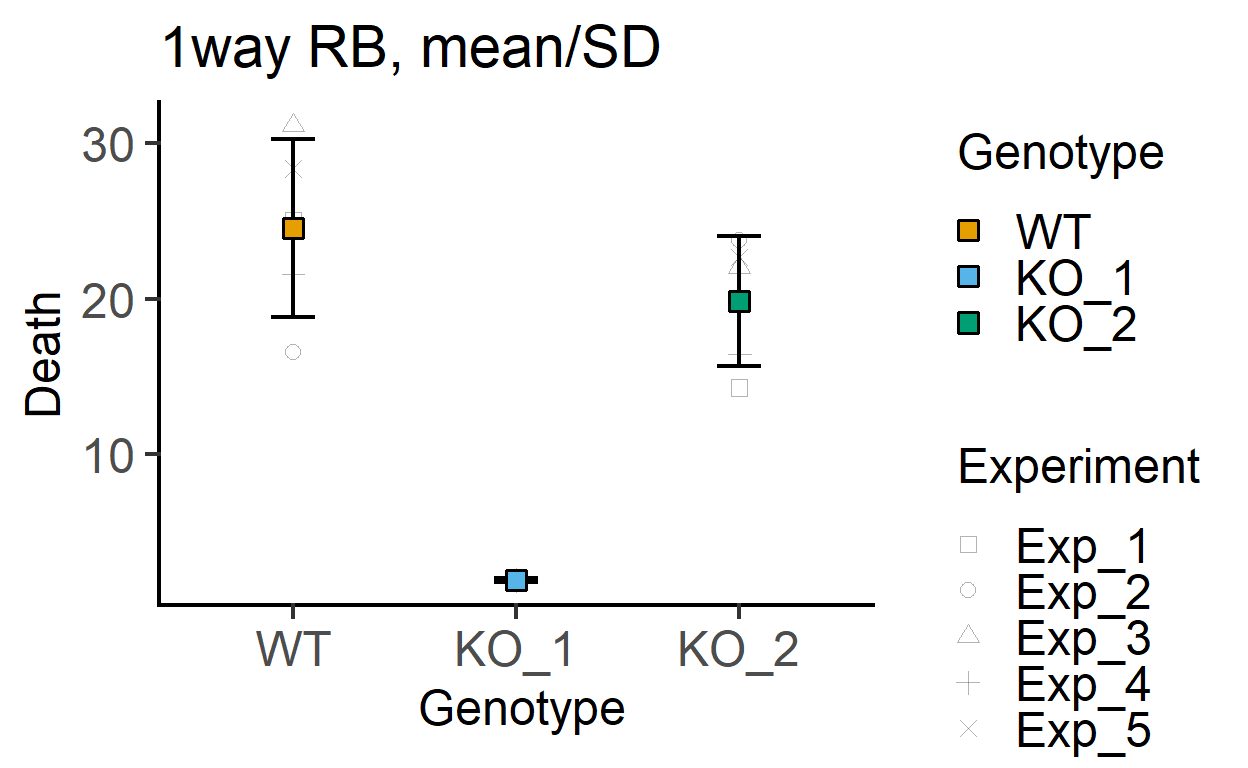
#no blocking variable
plot_point_sd(data_1w_death,
              Genotype,          #categorical X variable
              Death,             #numeric Y variable
              fontsize = 18)+    #font size
  labs(title = "1way RB, mean/SEM")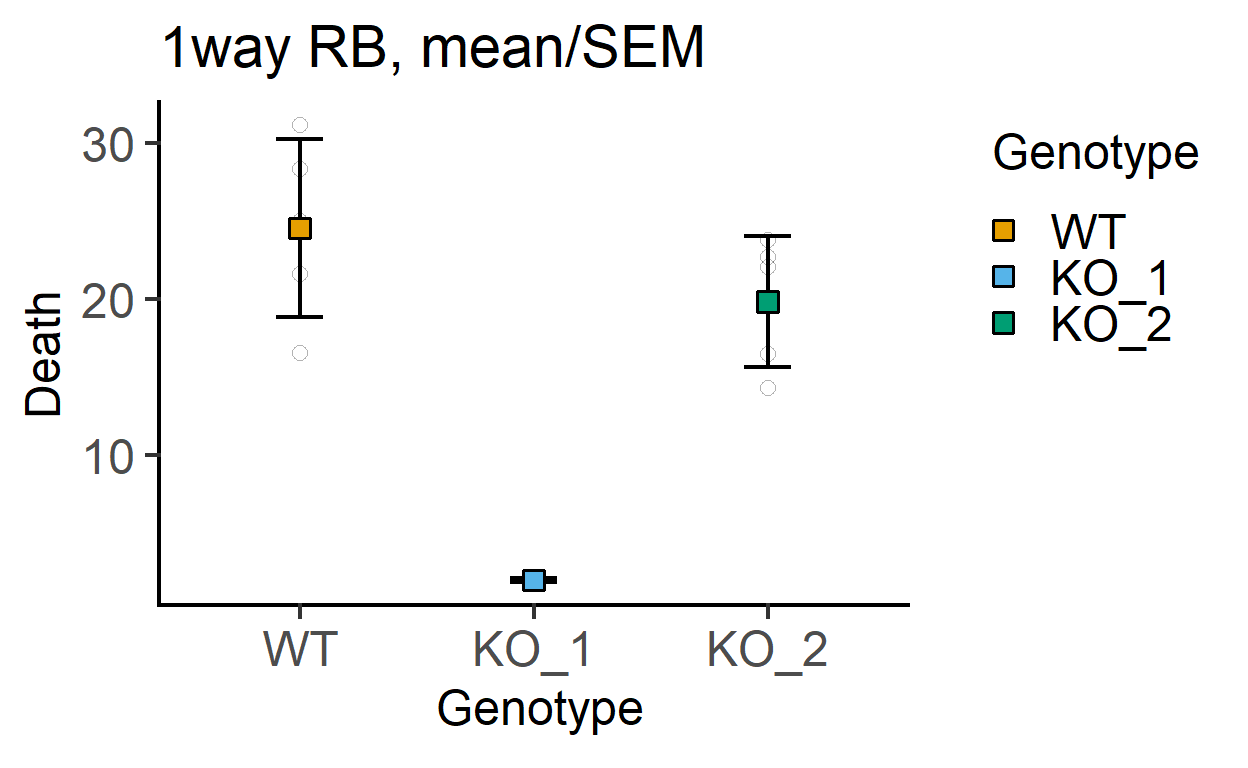
In these graphs, the shape of the small and large symbols can be changed.
plot_point_sd(data_1w_death,
              Genotype,          #categorical X variable
              Death,             #numeric Y variable
              all_shape = 0)+    #change shape of small symbols
  labs(title = "1way RB, mean/SEM",
       subtitle = "(all_shape = 0)")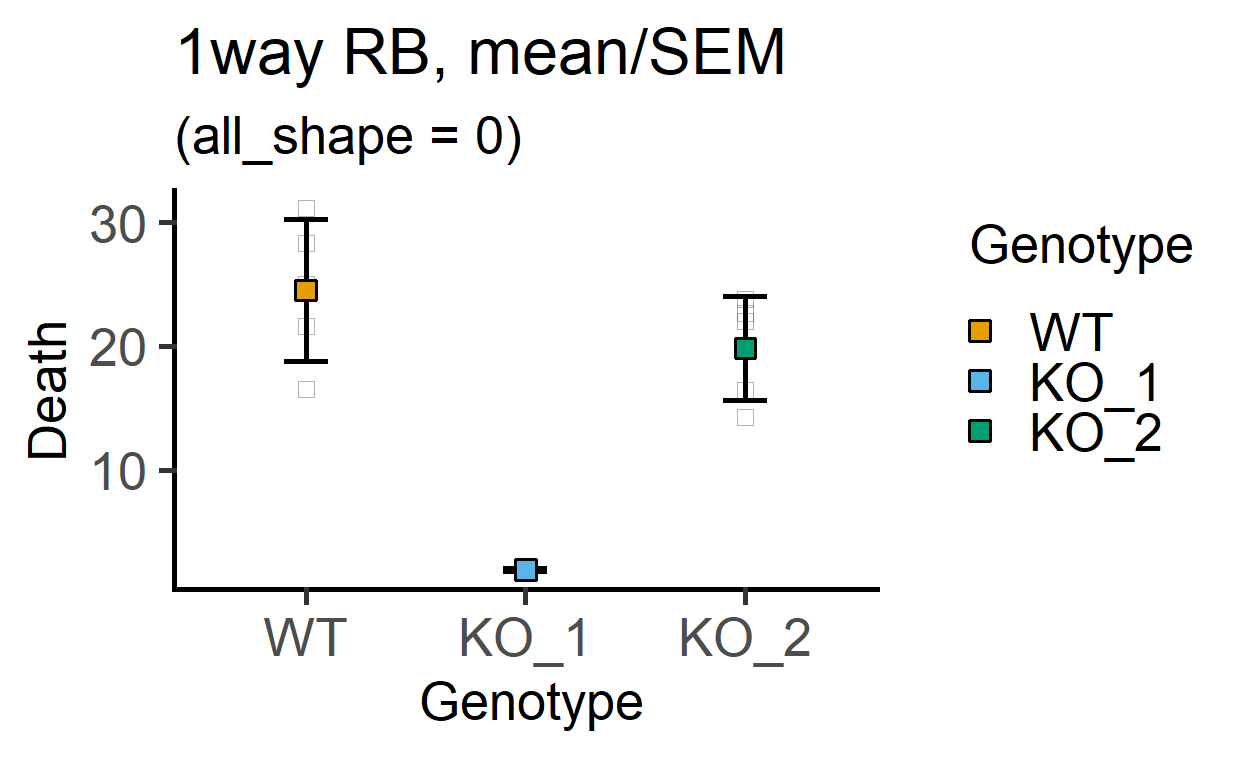
If you don’t want to use many different colours along the X axis, use the Single_colour argument.
plot_3d_scatterbox(data_1w_death, #data table
                   Genotype,      #X variable
                   Death,         #Y variable
                   Experiment,    #shape variable
                   SingleColour = "pale_red", #colour
                   fontsize = 18)+           #font size
  labs(title = "1w RB ANOVA, single colour")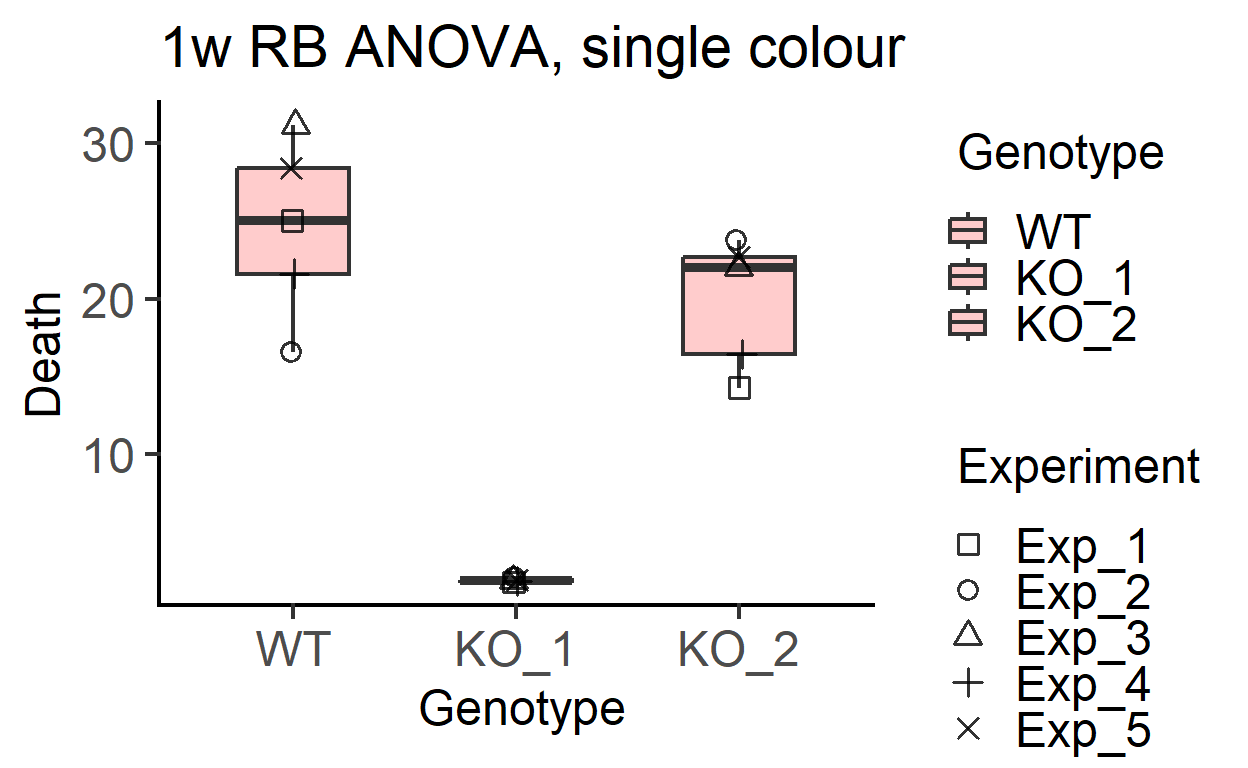
Two-way ANOVAs
All of the plot_4d_ functions can be used for two-way ANOVAs. They can also plot up to two additional variables.
Simple two-way ANOVA
Here use the plot_4d_point_sd, plot_4d_scatterbar, plot_4d_scatterbox or plot_4d_scatterbox as shown in the three or more variables vignette without supplying a value to the shape argument. This is new since v4.0 of grafify.
plot_4d_point_sd(data_2w_Tdeath,           #data table
                 Genotype,                 #categorical X variable
                 PI,                       #numeric Y variable
                 Time,                     #2nd categorical factor
                 fontsize = 18)+           #font size
  labs(title = "2way, mean/SD",
       subtitle = "(simple 2way ANOVA)")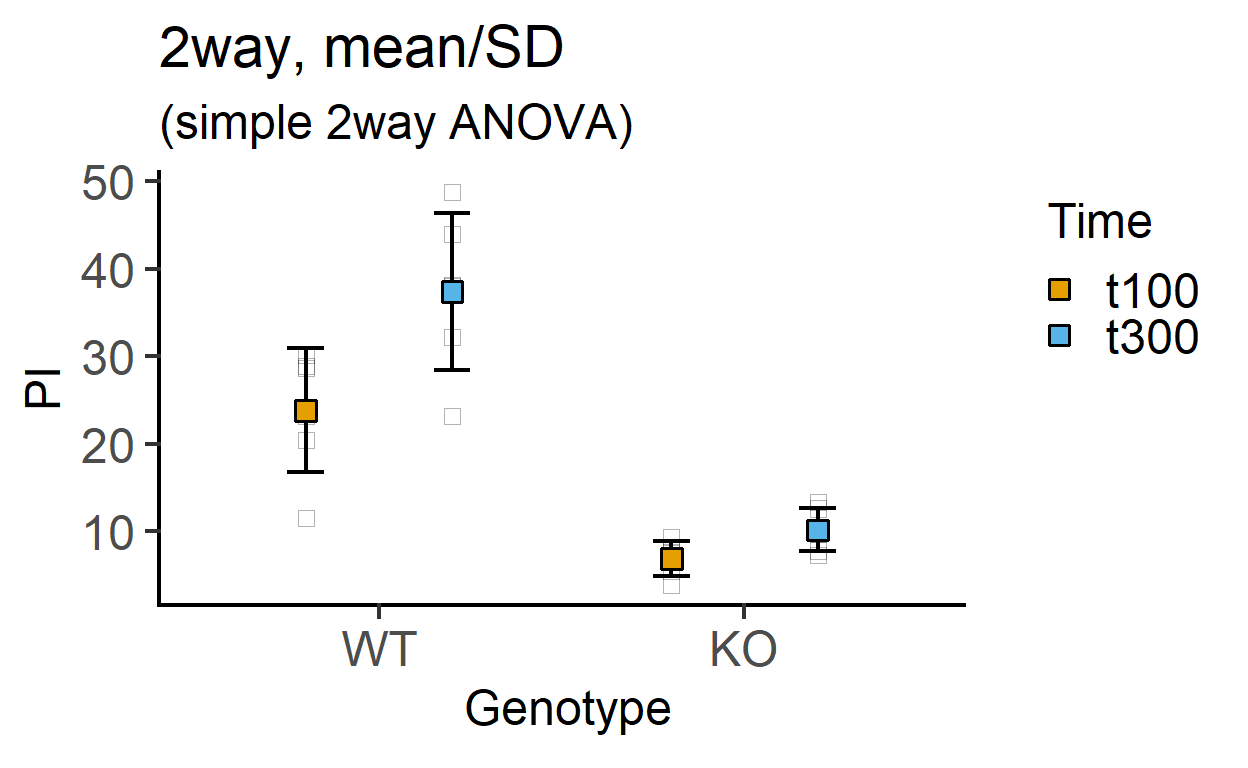
plot_4d_scatterbox(data_2w_Tdeath,           #data table
                   Genotype,                 #categorical X variable
                   PI,                       #numeric Y variable
                   Time,                     #2nd categorical factor
                   fontsize = 18)+           #font size
  labs(title = "2way, scatter/box",
       subtitle = "(simple 2way ANOVA)")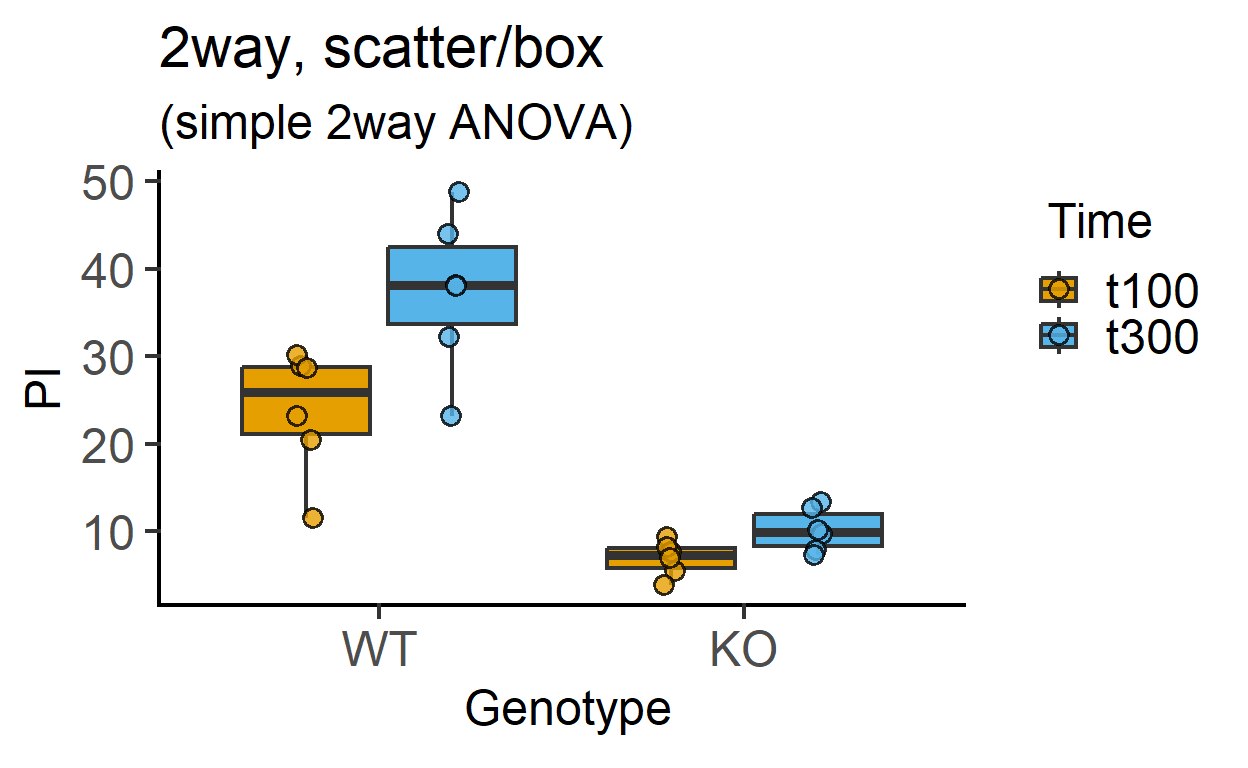
Two-way ANOVA with randomised blocks
Same as above but supply the blocking factor to the shapes argument. See more examples in the three or more variables vignette.
Compare these graphs with the ones above.
plot_4d_point_sd(data_2w_Tdeath,           #data table
                 Genotype,                 #categorical X variable
                 PI,                       #numeric Y variable
                 Time,                     #2nd categorical factor
                 Experiment,               #blocking factor
                 fontsize = 18)+           #font size
  labs(title = "2way/RM, mean/SD",
       subtitle = "(shapes = randomised blocks)")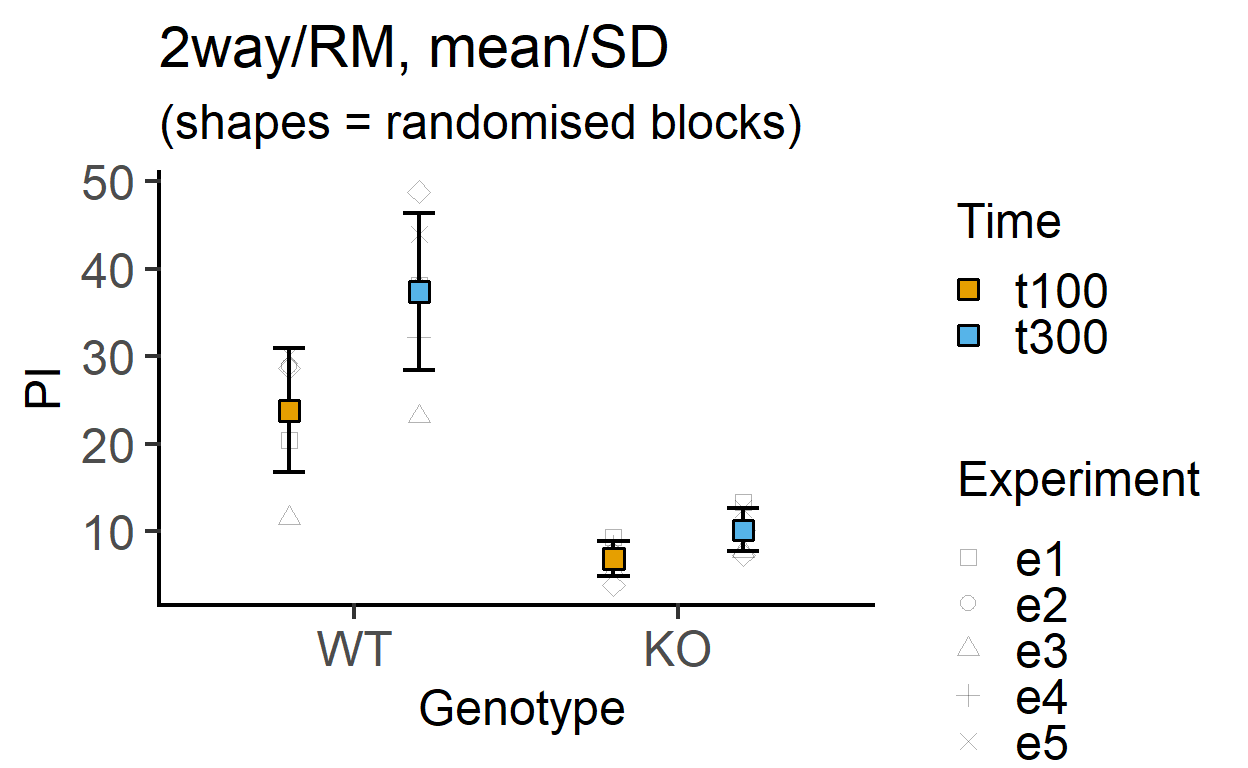
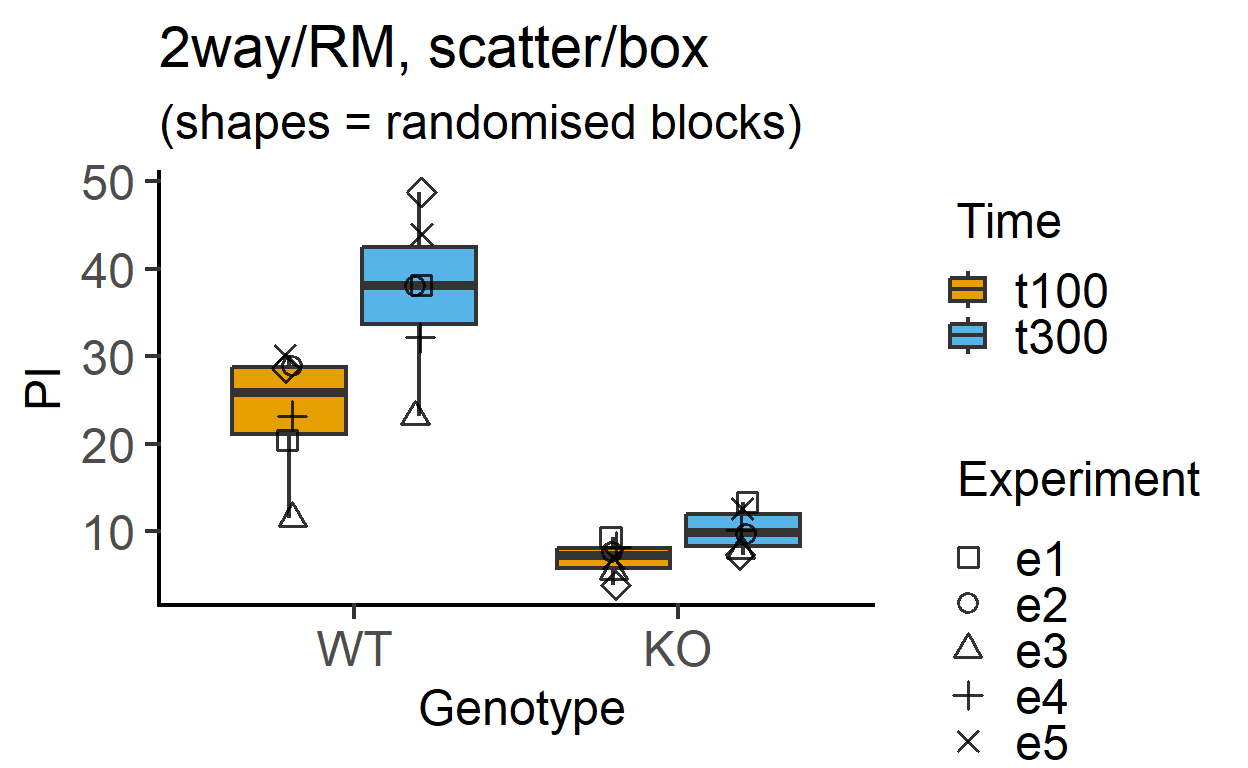
plot_4d_scatterbox(data_2w_Tdeath,           #data table
                   Genotype,                 #categorical X variable
                   PI,                       #numeric Y variable
                   Time,                     #2nd categorical factor
                   Experiment,                #blocking factor
                   fontsize = 18)+           #font size
  labs(title = "2way/RM, scatter/box",
       subtitle = "(shapes = randomised blocks)")