Data format
Like all other plot_ functions, these functions also require long-format table. In addition, a column that indicates matching between data is required to be passed on to groups argument. As an example, see data_t_pdiff from grafify, which is a dataset of paired or matched observations in two groups in the Subject column. Observations defined by the column passed on to the groups argument are joined by a line on the graph to show matching. These are also called before-after plots.
In the data below, the Subject column shows matching.
head(data_t_pdiff) #first 6 rows Subject Condition Mass
1 A Untreated 20.88634
2 A Treated 33.36158
3 B Untreated 21.01960
4 B Treated 33.88688
5 C Untreated 28.73167
6 C Treated 39.02329Two kinds of plots are available for plotting matched data, which match by shapes or colours. These functions need a categorical X variable (xcol), quantitative Y variable (ycol) and a column that contains the grouping or matching information (groups).
In grafify v3 onwards, before-after plots have an additional option to add box and whiskers to display data summary.
Saving graphs
See Saving graphs for tips on how to save plots for making figures.
Types of before-after graphs
plot_befafter_colours
The grouping or matching is mapped to the fill aesthetic of symbols.
plot_befafter_colours(data = data_t_pdiff,
                      xcol = Condition,
                      ycol = Mass,
                      match = Subject,
                      symsize = 5,
                      ColPal = "light",
                      ColRev = T)+
  labs(title = "Two-groups, matched colours",
       subtitle = "(`light` palette)")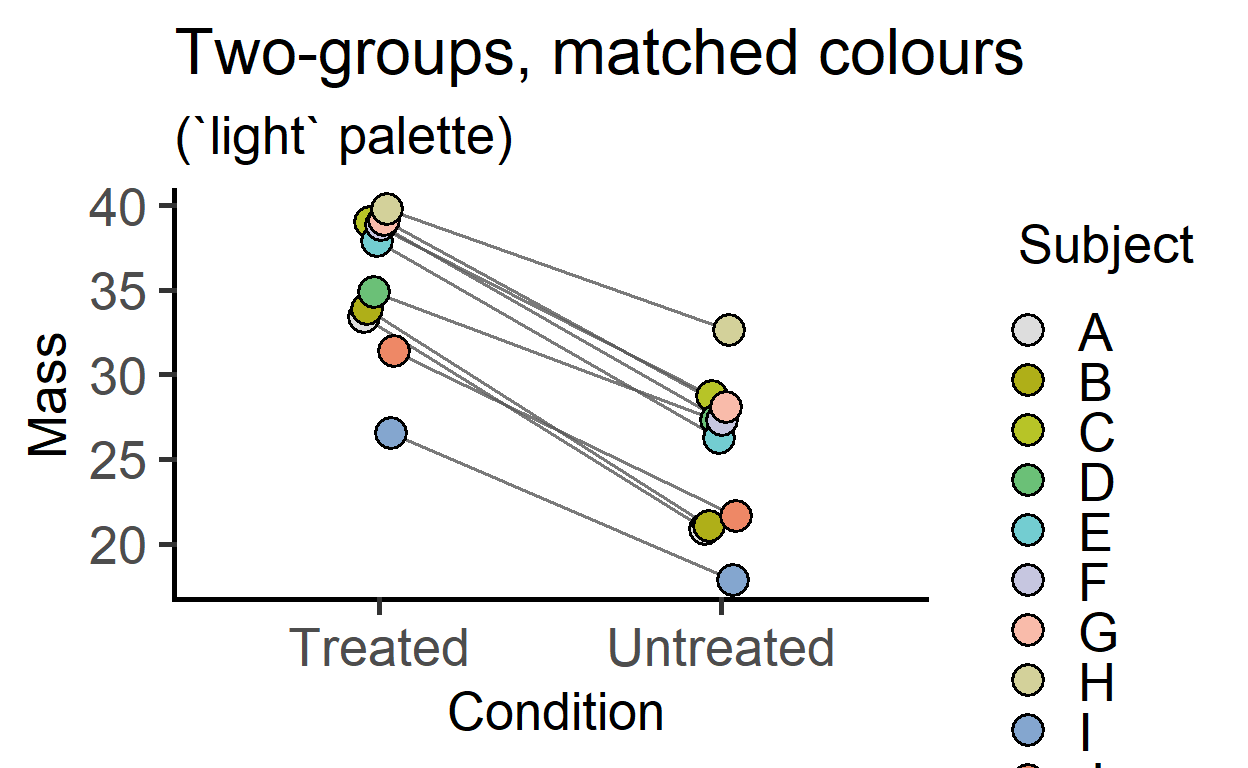
plot_befafter_colours(data = data_t_pdiff,
                      xcol = Condition,
                      ycol = Mass,
                      match = Subject,
                      Boxplot = TRUE, #new option in v3
                      symsize = 5,
                      ColPal = "light",
                      ColRev = T)+
  labs(title = "Two-groups, matched colours",
       subtitle = "with box & whiskers")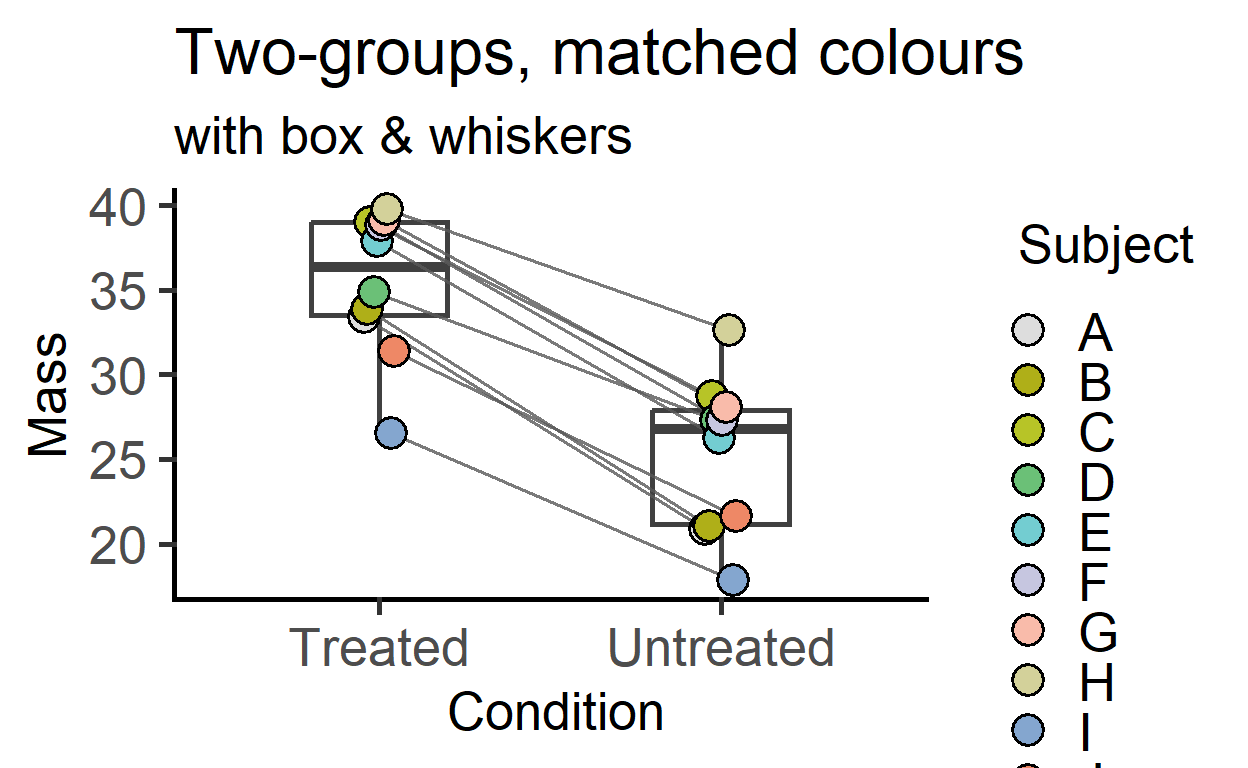
Two-way matched data plotted with faceting.
plot_befafter_colours(data_2w_Tdeath,
                      Time,
                      PI,
                      Experiment,
                      Genotype,    #facet argument
                      Boxplot = TRUE, #box plot
                      symsize = 3)+
  labs(title = "Two-way repeated measures",
       subtitle = "(matched shapes, `okabe_ito` palette)")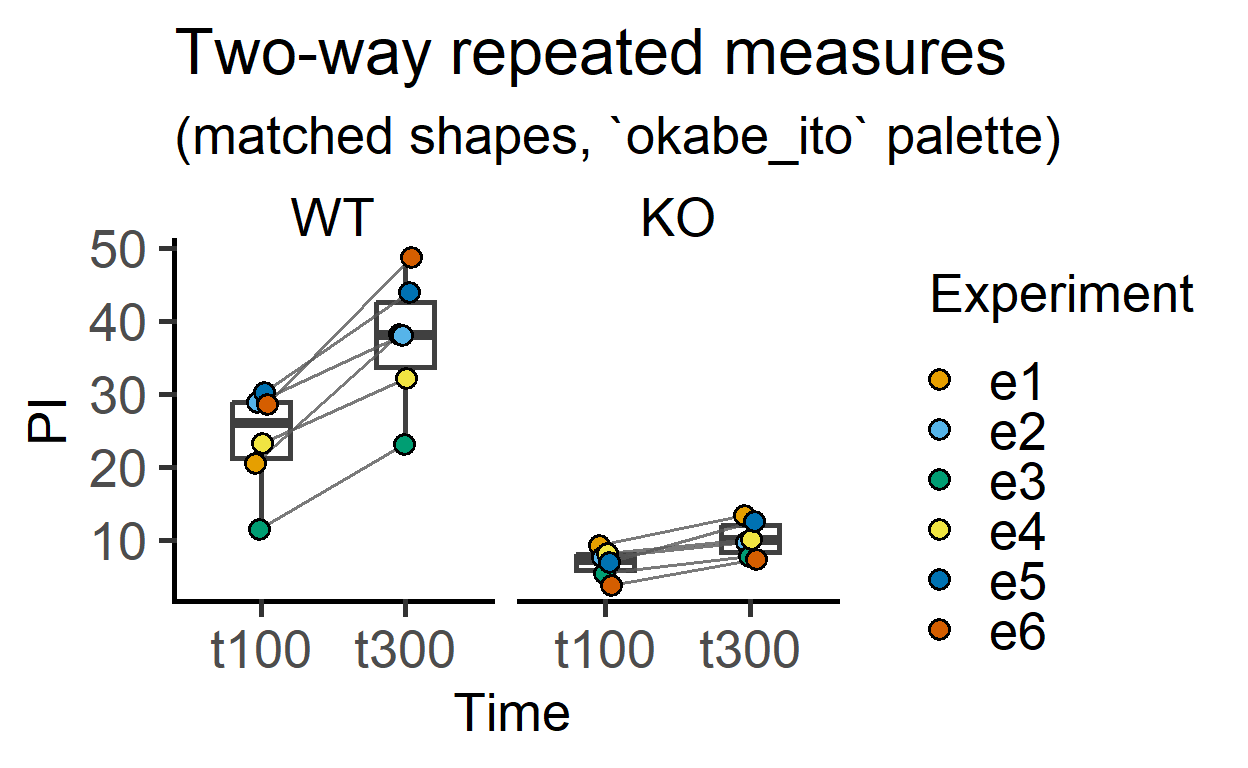
plot_befafter_shapes
This is very similar to matching by colour, but instead matched by shapes. The grouping factor is mapped to colour aesthetic of the shapes.
plot_befafter_shapes(data_1w_death,
                     Genotype,
                     Death,
                     Experiment,
                     symsize = 4,
                     ColPal = "r4")+
  labs(title = "Mutiple groups, matched shapes",
       subtitle = "(`r4` palette)")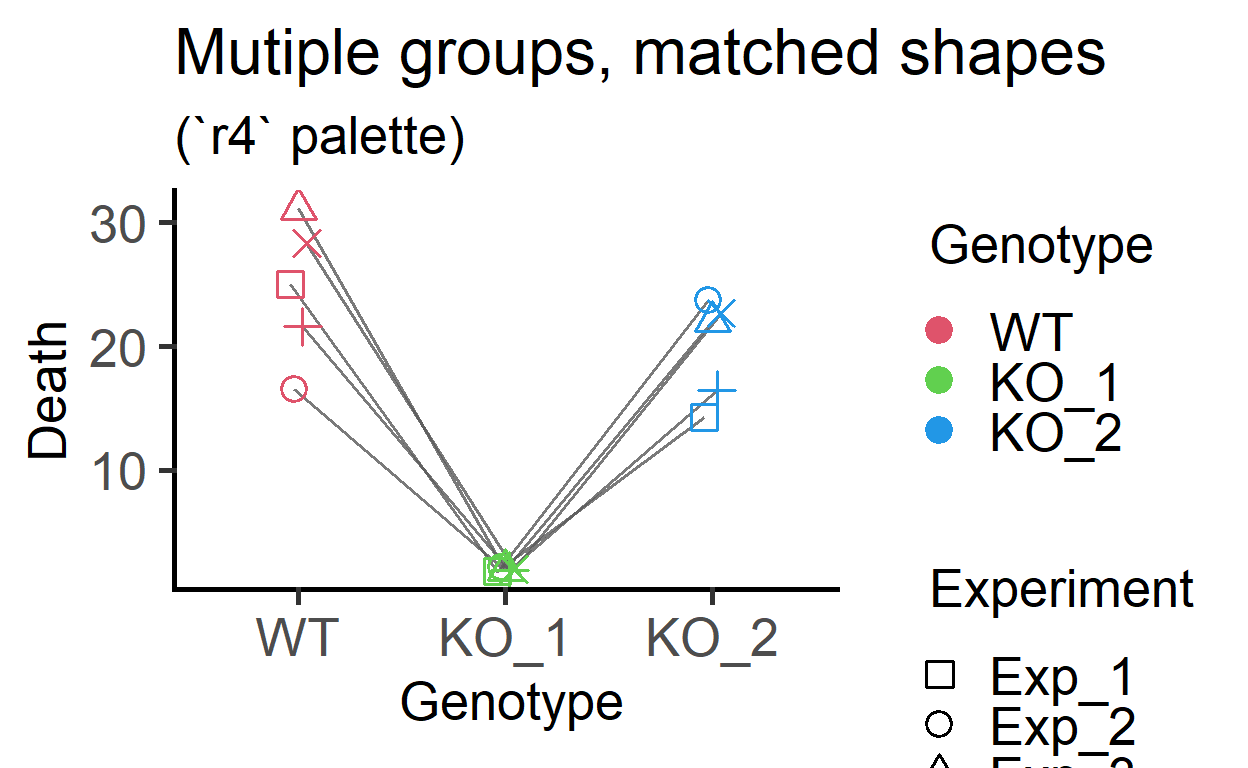
plot_befafter_shapes(data_1w_death,
                     Genotype,
                     Death,
                     Experiment,
                     Boxplot = TRUE,
                     symsize = 4,
                     ColPal = "r4")+
  labs(title = "Mutiple groups, matched shapes",
       subtitle = "(with box & whiskers)")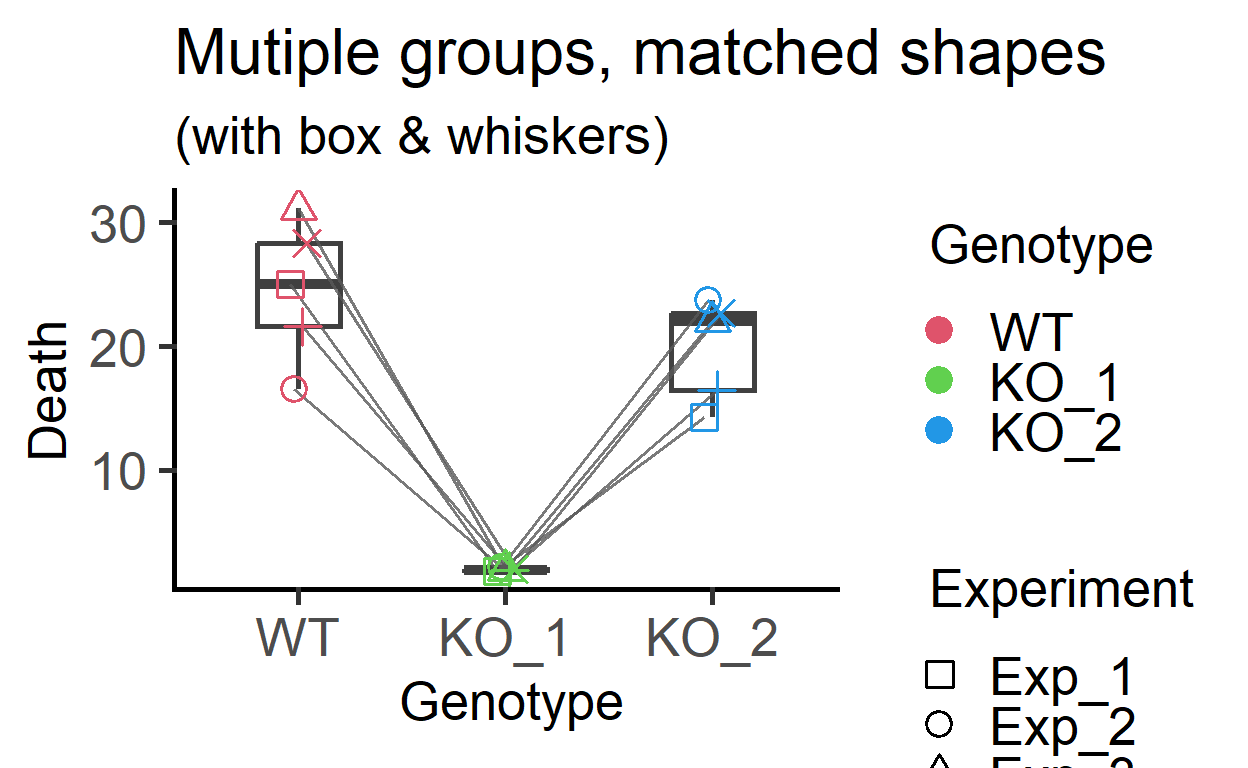
plot_befafter_ in single colour
#single colour with before-after colours
plot_befafter_colours(data_t_pdiff,
                      Condition,
                      Mass,
                      Subject,
                      Boxplot = TRUE,
                      SingleColour = "ok_orange")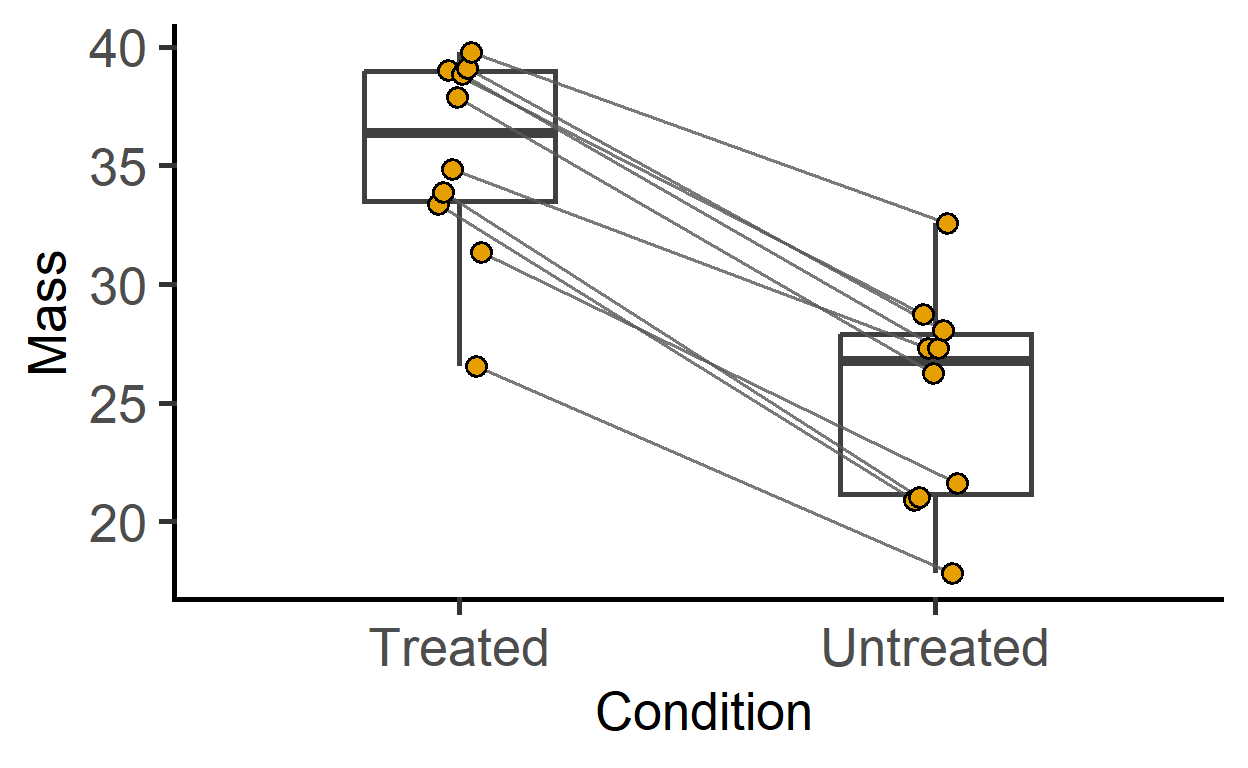
#single colour with before-after shapes
plot_befafter_shapes(data_t_pdiff,
                     Condition,
                     Mass,
                     Subject,
                     Boxplot = TRUE,
                     SingleColour = "ok_bluegreen")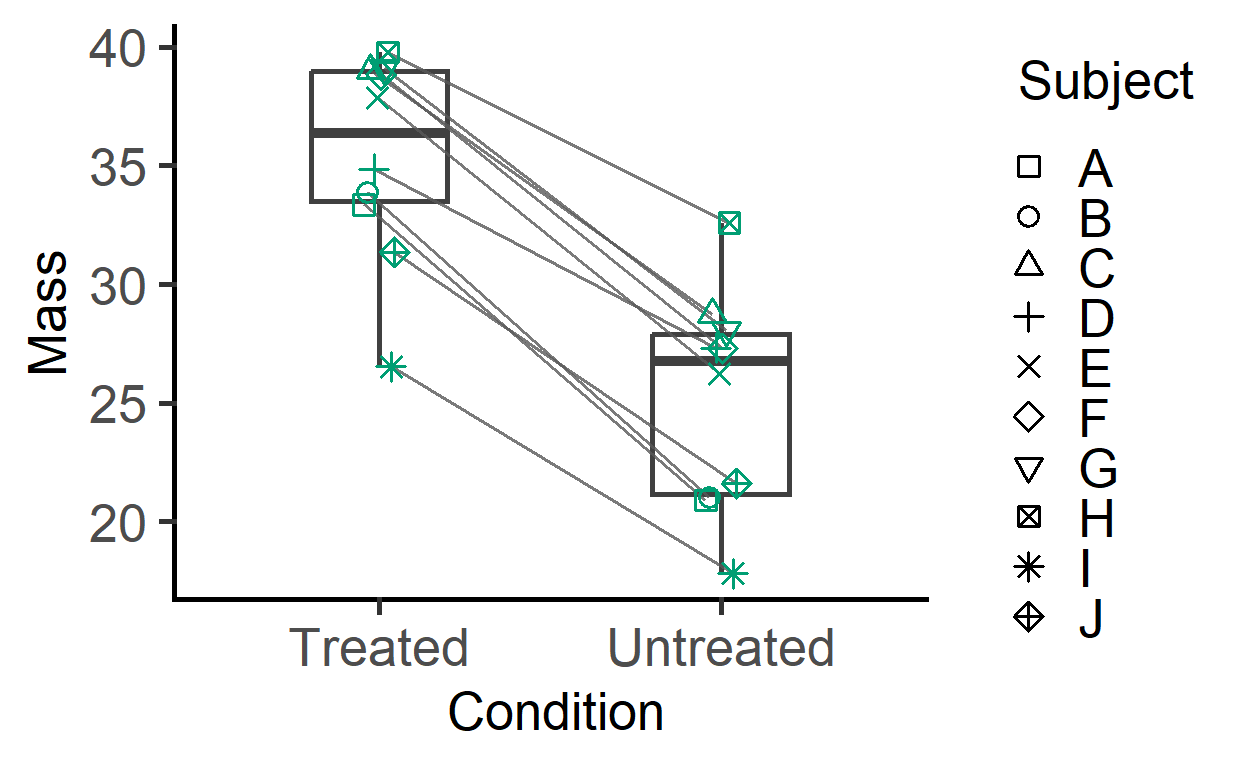
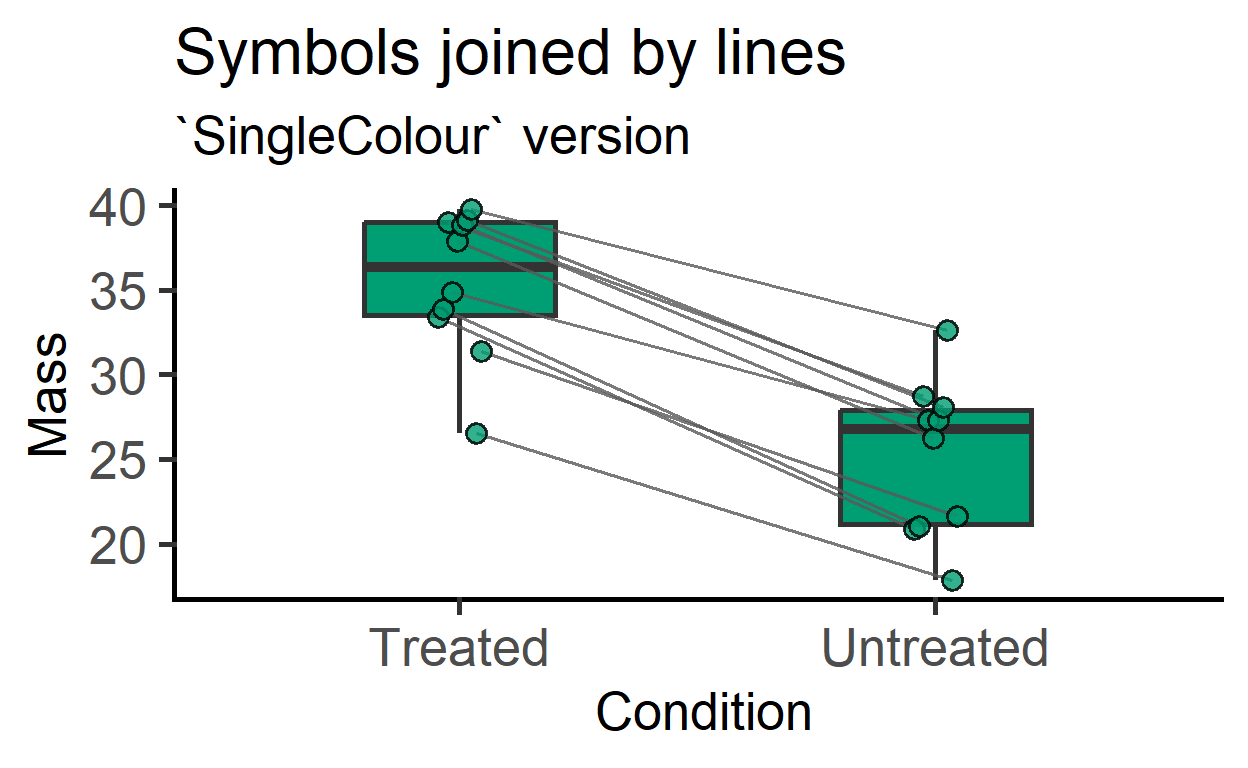
plot_befafter_box
This is new in v3 and allows filled colour in boxes along with lines joining symbols. Colours are mapped to the X-variable, or a SingleColour option can be chosen.
plot_befafter_box(data_t_pdiff,
                  Condition,
                  Mass,
                  Subject)+
  labs(title = "Symbols joined by lines",
       subtitle = "box & whiskers are default")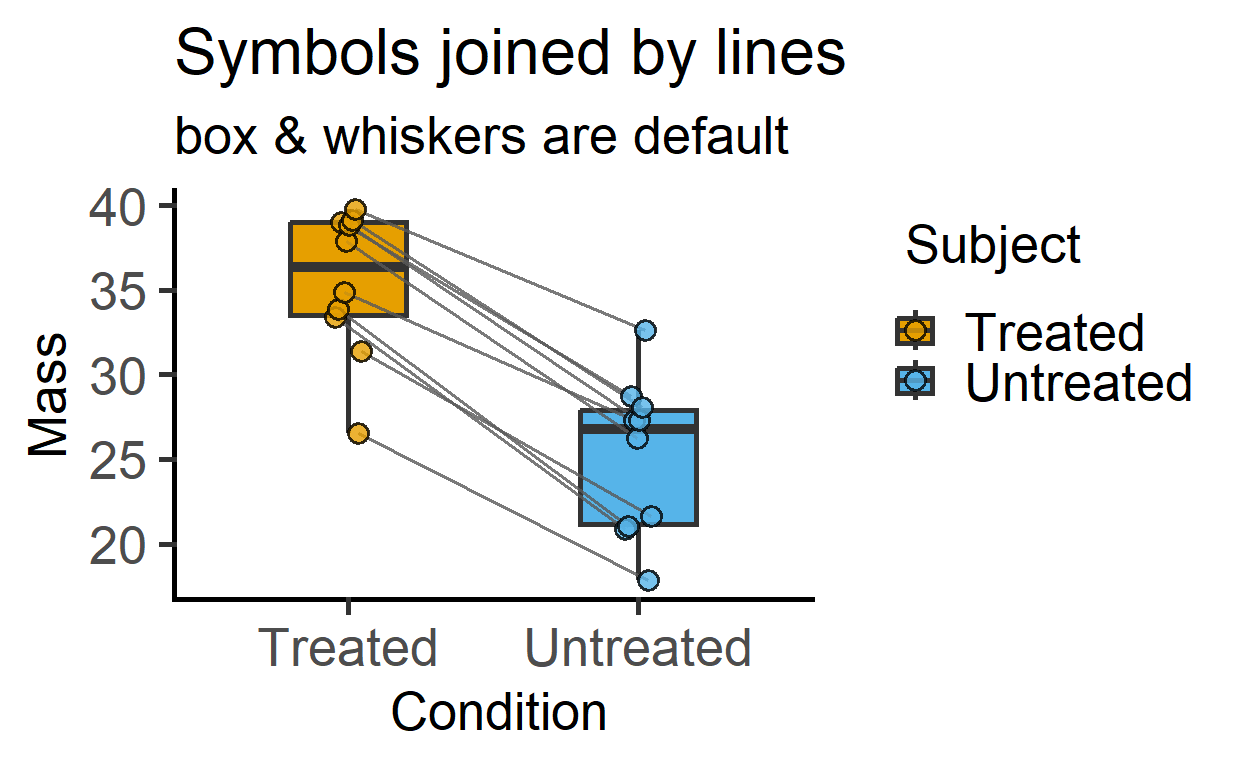
plot_befafter_box(data_t_pdiff,
                  Condition,
                  Mass,
                  Subject,
                  SingleColour = "ok_bluegreen")+
  labs(title = "Symbols joined by lines",
       subtitle = "`SingleColour` version")