Changing error bars
Version 3.1.0 onwards, error bars can be changed from the default SD (sample standard deviation) to SEM (standard error of the mean) or CI95 (95% confidence intervals based on t distributions). These are implemented through mean_sdl (with multi = 1), mean_se and mean_cl_normal from Hmisc.
Data format
All plot_ functions require a long-format data table as the first argument, followed by the name of the column (a categorical variable) to be plotted on the X-axis (xcol) and the quantitative variable to be plotted on the Y-axis (ycol). If provided in this order the data =, xcol = and ycol = need not be explicitly called (see examples below).
See the data help page and ensure data table is in the long-format.
Saving graphs
See Saving graphs for tips on how to save plots for making figures.
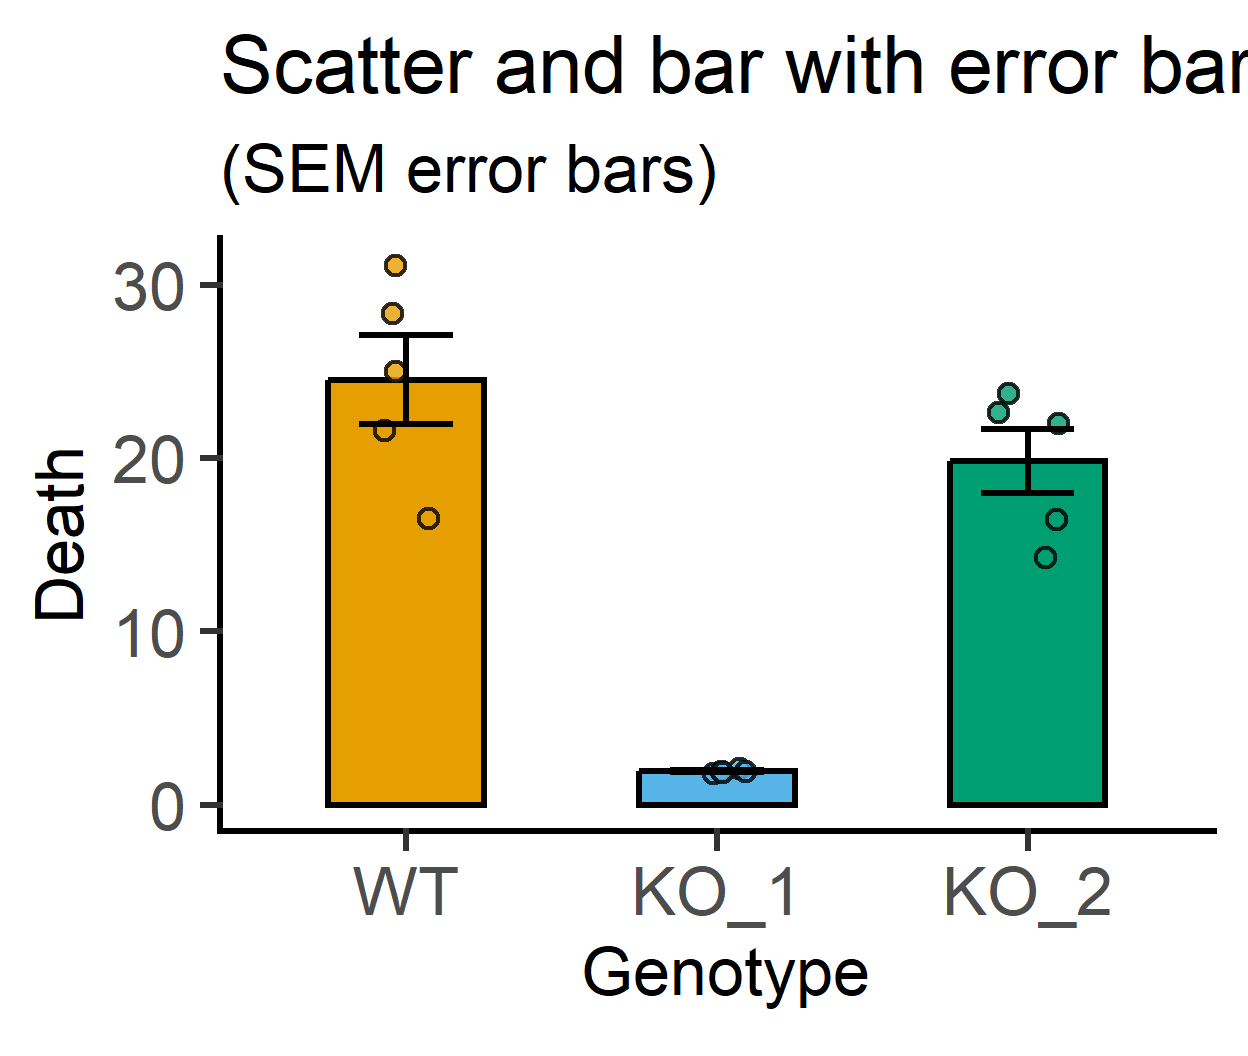
Different types of error bars
ErrorType argument
Error bars can be changed in plot_point_sd, plot_scatterbar_sd, plot_3d_scatterbar, plot_4d_scatterbar, plot_dotbar_sd. In all cases, ErrorType is the argument after facet.
The acceptable inputs are “SD”, “SEM” or “CI95”. Some examples are shown below.
#default SD error bars
plot_scatterbar_sd(data = data_1w_death, #data table
xcol = Genotype, #X variable
ycol = Death, #Y variable
fontsize = 25)+
labs(title = "Scatter and bar with error bars", #title
subtitle = "(default SD error bars)")+
guides(fill = "none")
#SEM error bars
plot_scatterbar_sd(data = data_1w_death, #data table
xcol = Genotype, #X variable
ycol = Death, #Y variable
fontsize = 25,
ErrorType = "SEM")+ #SEM error bars
labs(title = "Scatter and bar with error bars", #title
subtitle = "(SEM error bars)")+
guides(fill = "none")
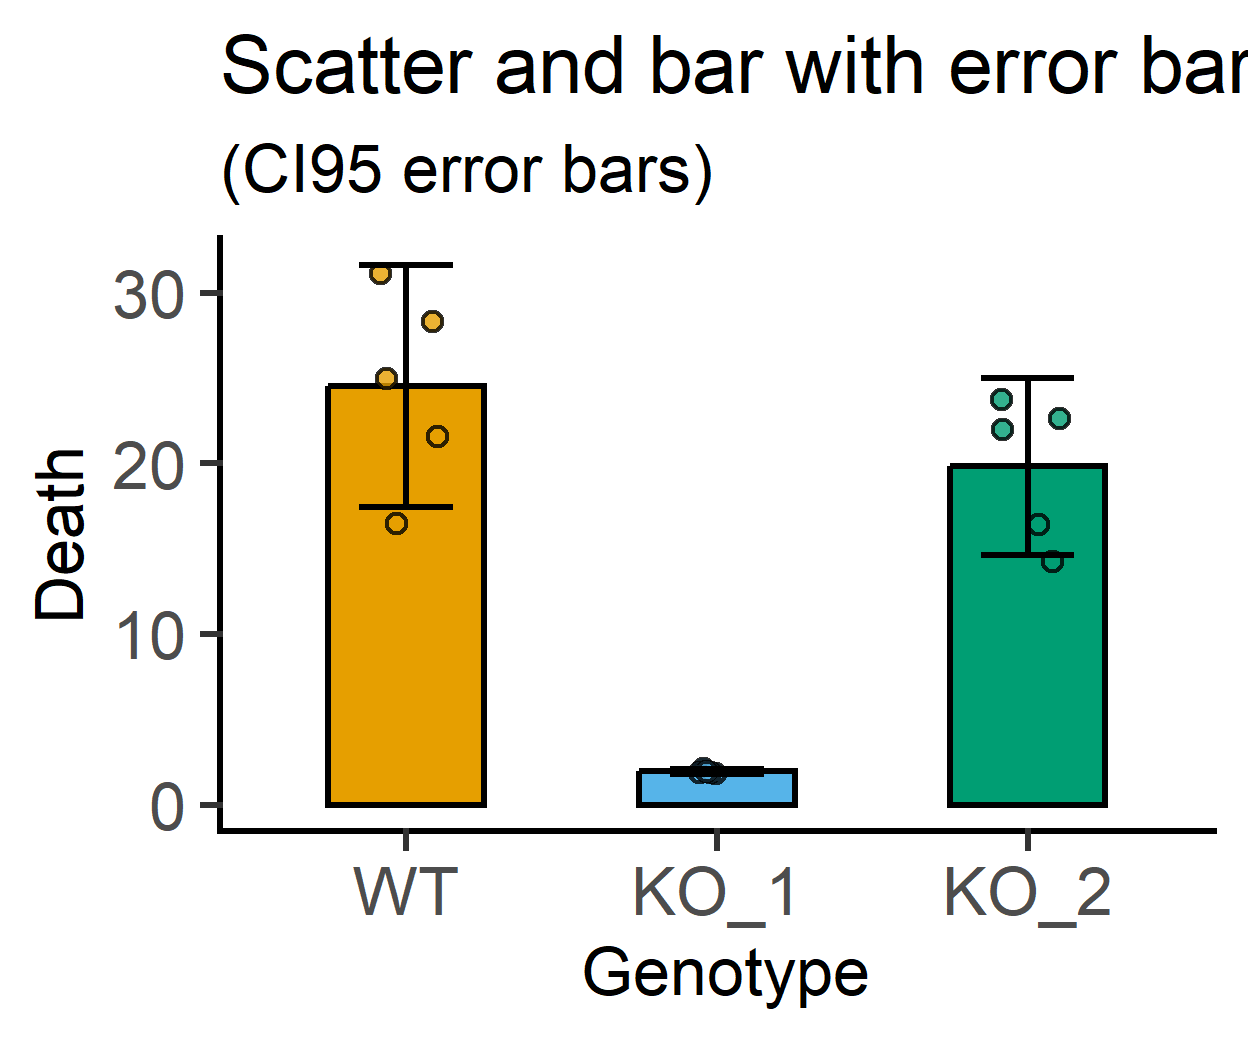
#CI95 error bars
plot_scatterbar_sd(data = data_1w_death, #data table
xcol = Genotype, #X variable
ycol = Death, #Y variable
fontsize = 25,
ErrorType = "CI95")+ #CI95 error bars
labs(title = "Scatter and bar with error bars", #title
subtitle = "(CI95 error bars)")+
guides(fill = "none")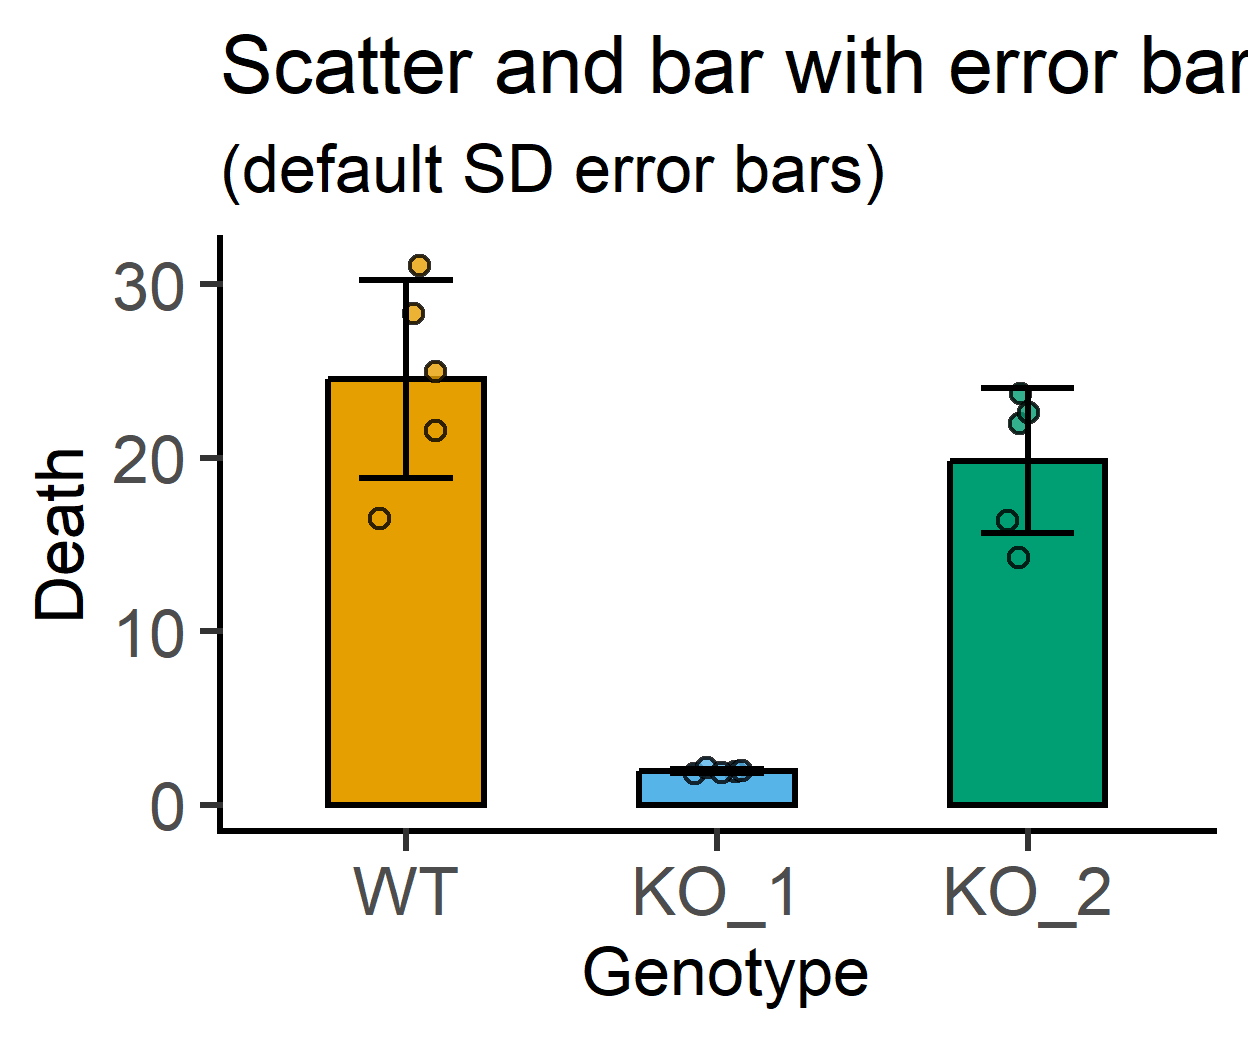
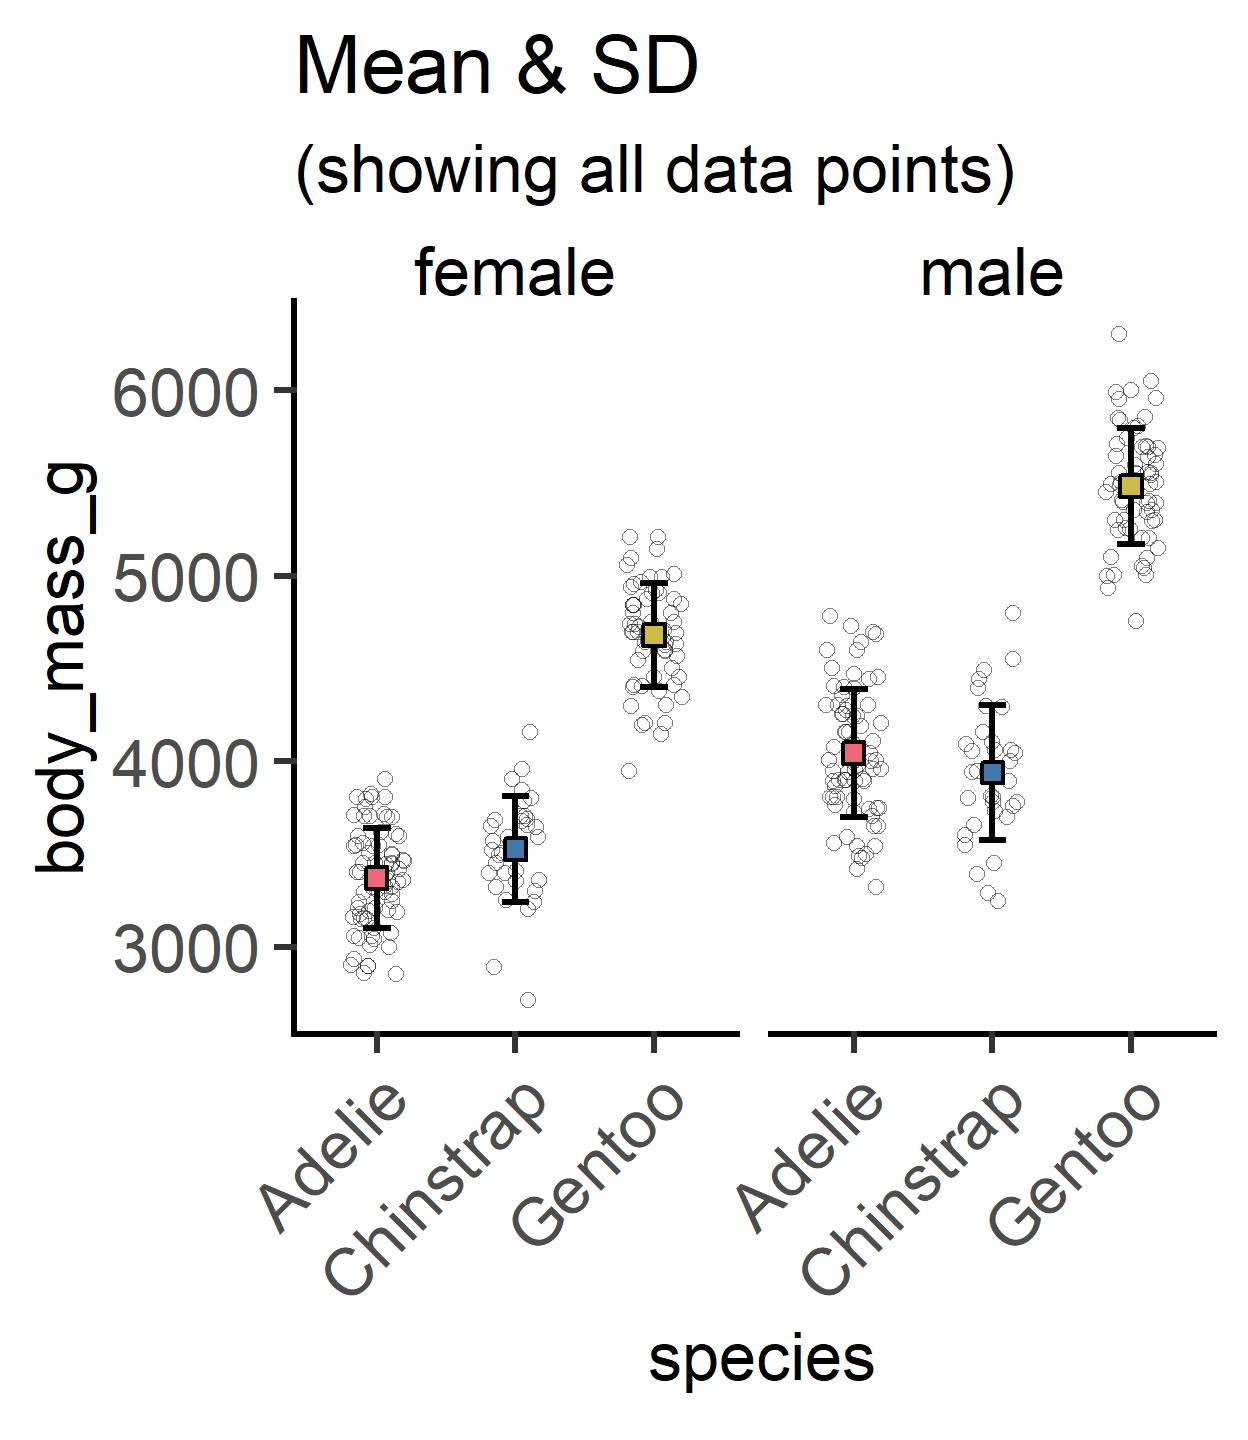
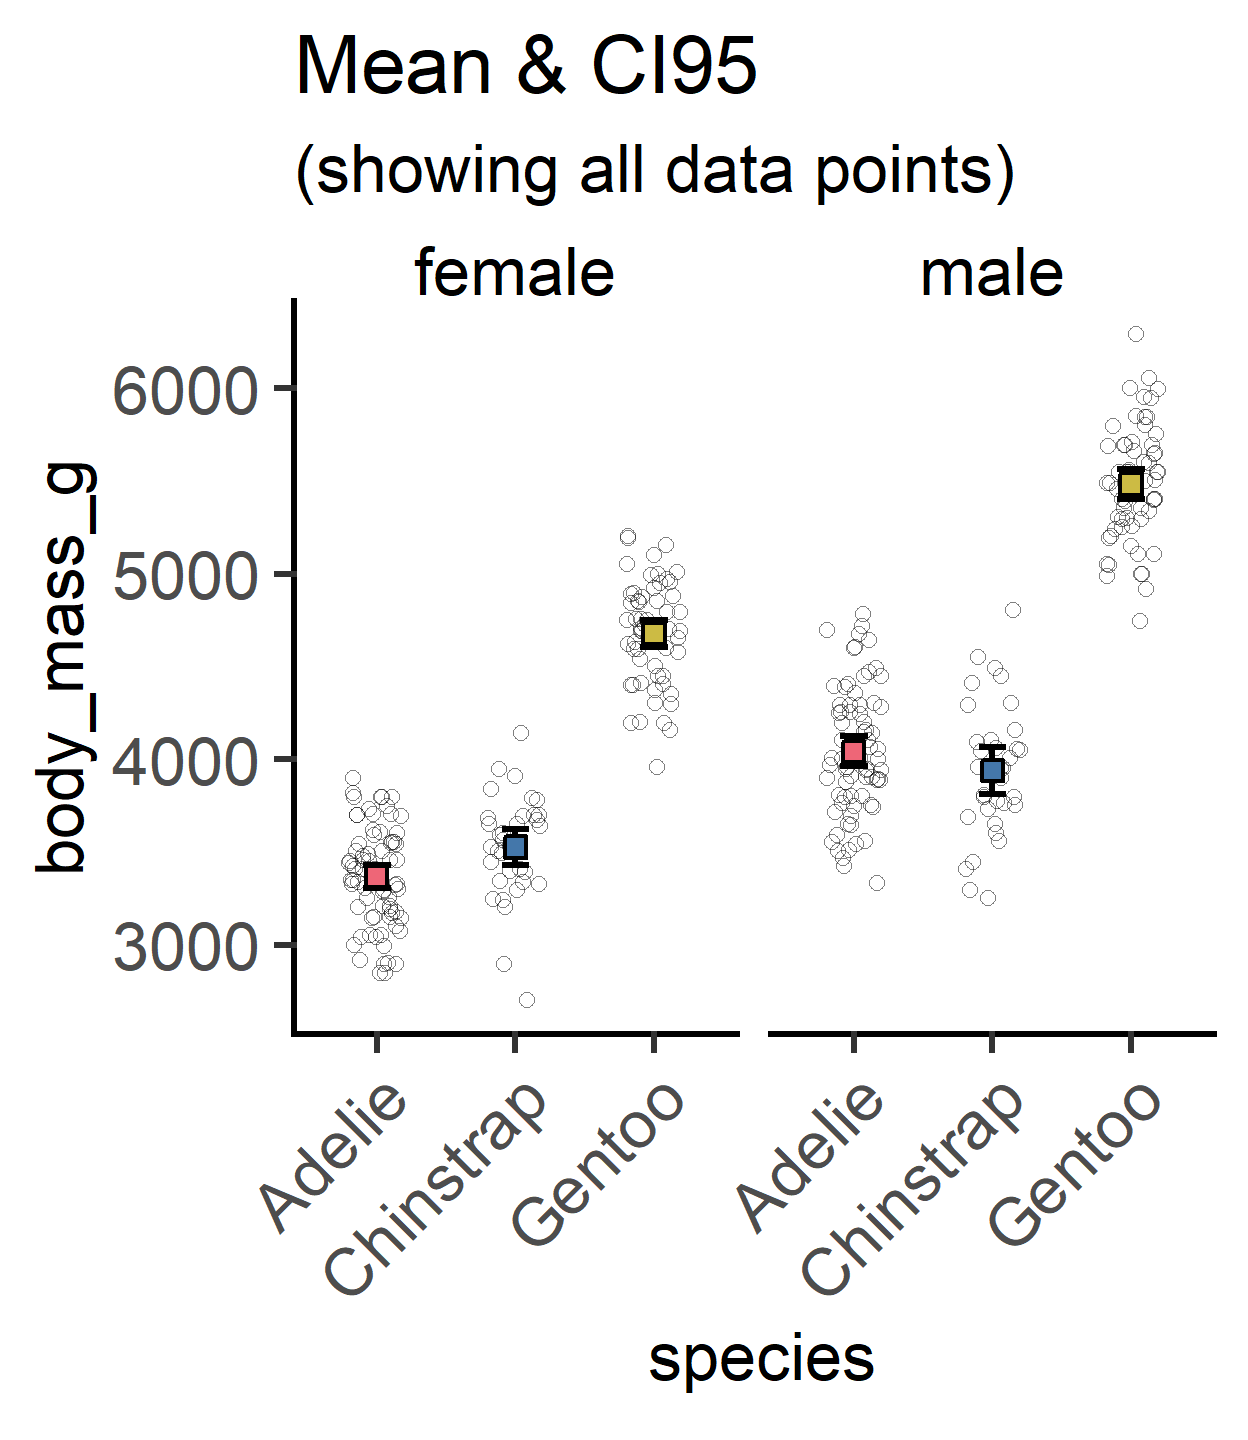
plot_point_sd
Since v3.1.0, this function also allows the user to show all data points in addition to a large symbol for the mean. Error bars can now be changed from default “SD” to “SEM or”CI95”.
Example below with palmerpenguins dataset.
plot_point_sd(penguins,
            species,
            body_mass_g,
            sex,                 #facet
            all_alpha = 0.5,     #opacity for all data
            all_jitter = 0.2,    #jitter for all data
            ColPal = "bright",
            TextXAngle = 45,
            fontsize = 25)+
  labs(title = "Mean & SD",
       subtitle = "(showing all data points)")+
  guides(fill = "none")

plot_point_sd(penguins,
            species,
            body_mass_g,
            sex,                 #facet
            all_alpha = 0.5,     #opacity for all data
            all_jitter = 0.2,    #jitter for all data
            ErrorType = "CI95",  #CI95 error bars
            ColPal = "bright",
            TextXAngle = 45,
            fontsize = 25)+
  labs(title = "Mean & CI95",
       subtitle = "(showing all data points)")+
  guides(fill = "none")