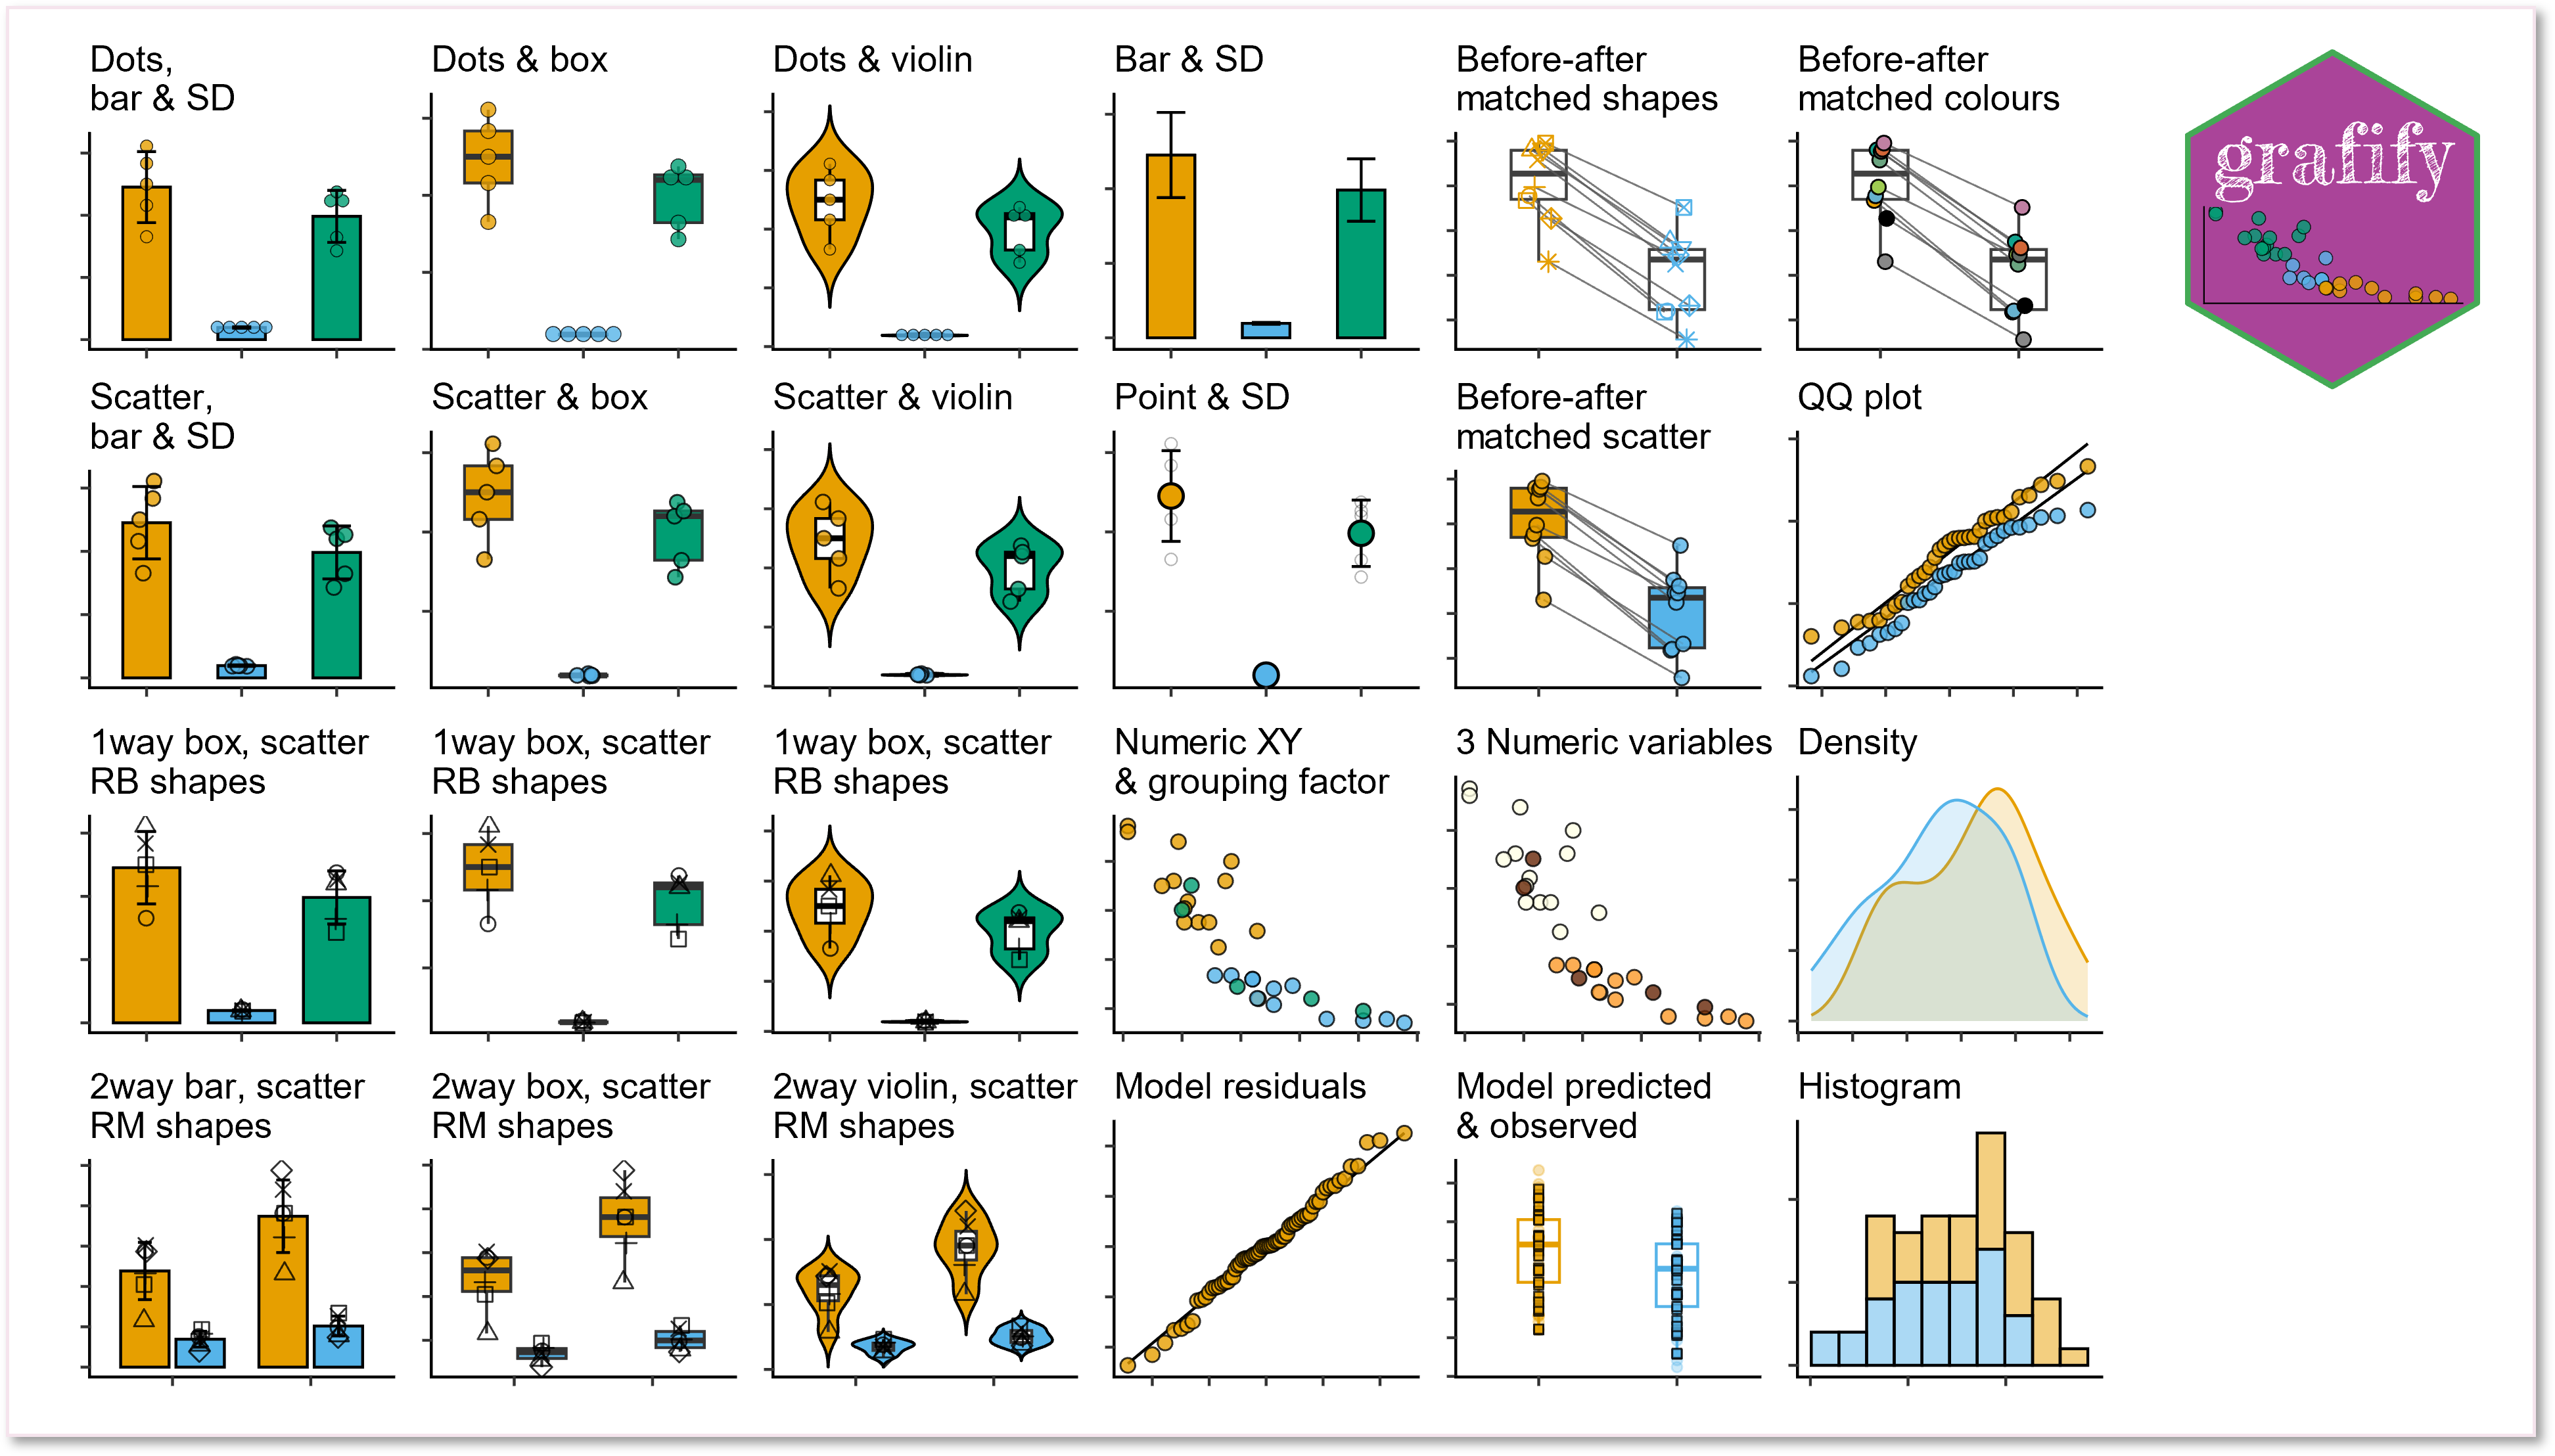
grafify gallery
Installation & getting started
Latest version: v5.1.0 on CRAN or GitHub
grafify is now on CRAN and can be installed by typing install.packages("grafify").
Any updates not yet on CRAN will be made available on GitHub. To install from GitHub you also need to install the remotes package. Then type remotes::install_github("ashenoy-cmbi/grafify@*release").
grafify requires the following packages to be installed: car, emmeans, ggplot2, Hmisc, lme4, lmerTest, magrittr, mgcv, patchwork, pbkrtest, purrr, stats, tidyr.
What can grafify do?
It makes easier for new (or advanced) users of R do the following:
- plot great-looking graphs with few lines of code while exploring data
- apply colour blind-friendly palettes to graphs plotted with
grafifyorggplot2 - use linear models for ANOVA, including randomised block and repeated-measures designs; or use generalised additive models (gams) for time-series
- get post-hoc comparisons (estimated marginal means and P values) between groups of interest
- simulate 1-way and 2-way ANOVA data
- practice R with built-in datasets
Colour Palettes
Twelve colour blind-friendly palettes are available for categorical/nominal/discreet variables.
Five colour schemes are available for quantitative data, including three sequential and two divergent schemes.
Colour schemes are implemented from excellent blogs by Paul Tol, the Okabe-Ito scheme, Mike Mol’s blog, and the cols4all package.
In addition to using these palettes with grafify graphs, these can be applied to ggplot2 objects.

Basic biological statistics
Also visit the companion website on Statistics for Mico/Immuno Biologists which describes statistical tests and using base R functions to execute them (e.g. with lme4, emmeans, ggplot2).
Citation
If you use grafify, please cite
Shenoy, A. R. (2021) grafify: an R package for easy graphs, ANOVAs and post-hoc comparisons. Zenodo. http://doi.org/10.5281/zenodo.5136508
Latest DOI for all versions: ![]()
grafify hexsticker